November 2012
Python program
The install of the ignition is now completed. The ignition map is still the oem Microplex Marelli ecu.
Before 'fine' tuning the map, I asked myself about the data sent by genboard.
VT is a nice tool but for analysis,it may be better to have his own , so I made a Python program
http://www.vems.hu/files/maserati/vemslog.zip
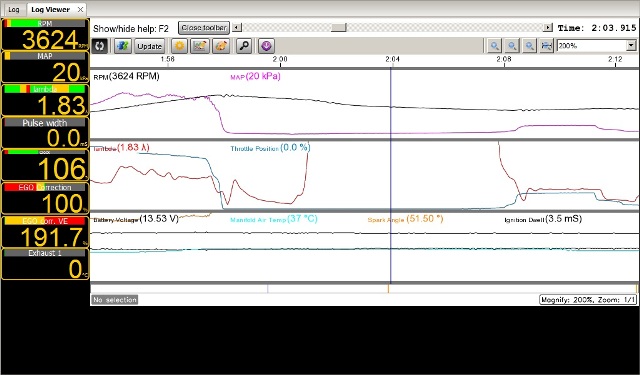
which function plotvlog runs the .csv log file as converted by VT. The arguments are the name of the .csv file and a list of variable names to plot. With ['RPM','MAP',Spark','TP'] one gets
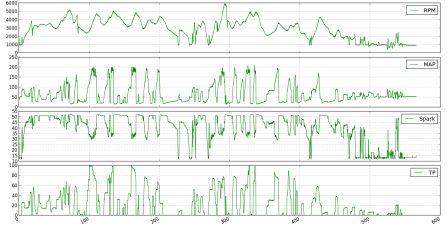
For some reasons variable names from the header of the .csv file are not always the VT ones: TP here is the Throttle Position.
Of course the plot got under Python is interactive plot and allows to zoom etc ...
Noisy RPM VemsLog data
- Noise when idling
The Panvas dataFrame returned by plotvlog can be analysed interactively with Pylab.
Under Ipython with
>plot(dat.index,dat['RPM'])
>plot(dat.index,dat['RPM'],'x')
I got a RPM/time plot where I zoomed a 5 s period of idling:
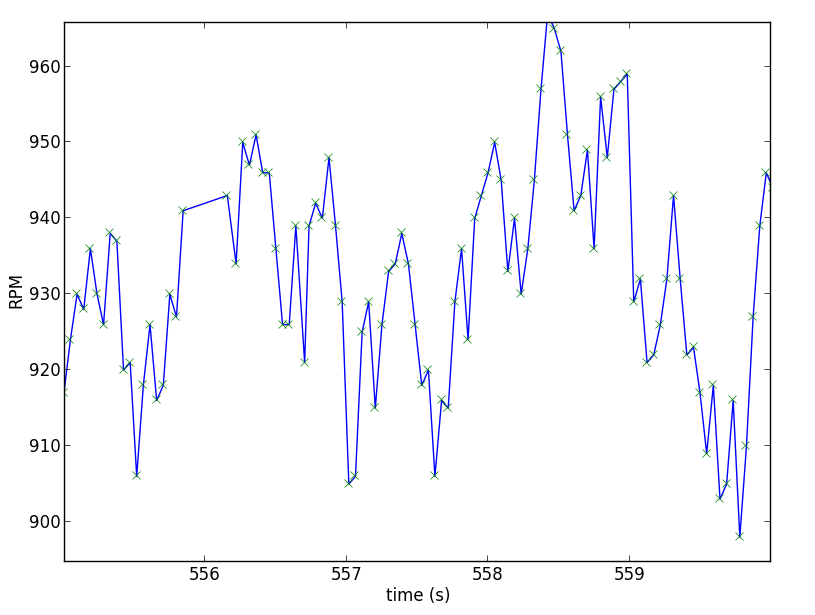
the green crosses 'x' are the RPM values sent by Genboard each 44 ms (or so, this is not the loop period of the internal genboard processing)
On this graph, one sees a large oscillations of the speed due to the idling valve around 925rpm and some big jumps, sometimes as large as 20rpm, at 2 successive 'x' (40ms)
At this idle speed, 40ms is about 220°. As the fire events for this odd engine are 90°,150°,90°,150°, 2 fires can occur during 40ms and this may explain the large increase or decrease of the speed.
However the question is
- Are these jumps equally due to any noise added by genboard/VT?
- Noise when running
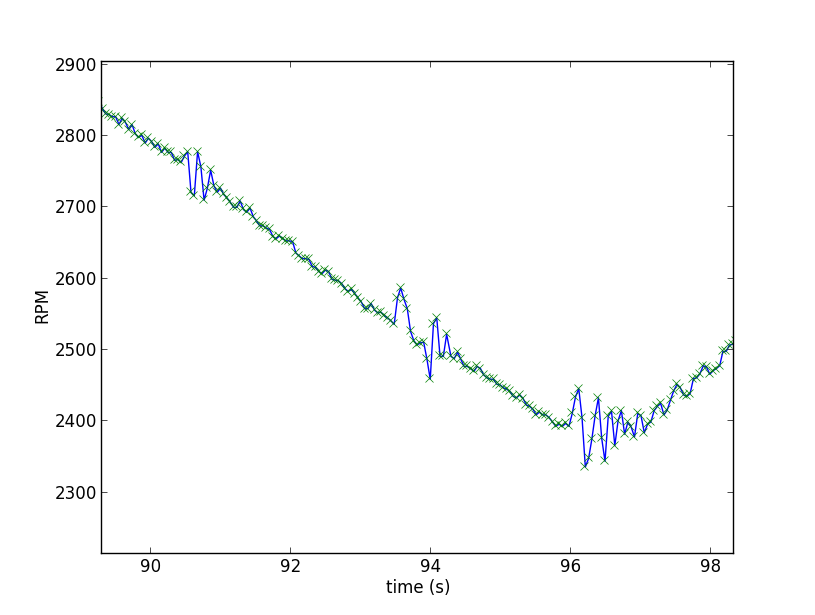
Some strange transients here occur from time to time
 .
.
It looks like the response of a 2nd order filter to some impulsive input.
I have never noticed any misfire when driving, besides they would not make the speed accelerate at the begining. Moreover the pic to pic may be as large as 100rpm. - Nothing on the MAP graph
I do not have any explanation yet.
Meanwhile I keep hacking my python program. Now it allows to better show details of these transients: 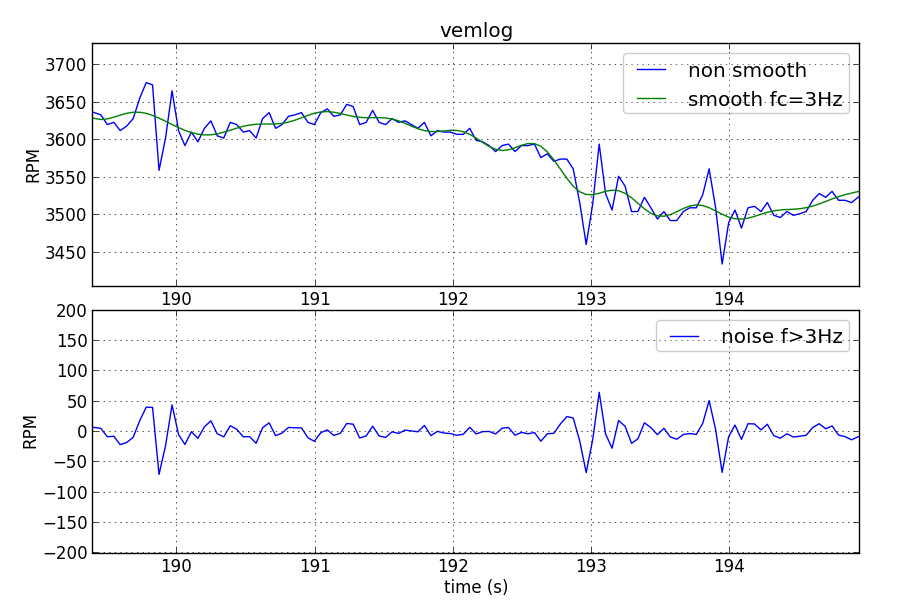
What about TriggerLog data ?
If one gives the cylinder number to the primary trigger related to it, written in bold when the cylinder has to fire, s being the secondary trigger, we have
s63s 42 51 63 42 51 s63s...
Small gaps are 30°, large ones are 90°.
The fw computes the revolution speed after each short gaps, if primary_trigger bit4==1
- or after each large gap, if primary_trigger bit4==0
This speed is send to VT at a cte freq, this gives some artificial variation of the speed wich depends of the distance of the last fire at the time the value is sent.
VT allow to make .csv files from a trigger log. Unluckily, for some reasons, the spark events are not recorded.
- For the most interesting RPM, there happen beyond 300 spark events per second, beyond the log-rate.
- But the per-cylinder (event) variations of primary-trigger times (RPMs) are actually recorded in "individual-power" data, which is of immense-use to find out when 1 cyl is misbehaving.
- for an even-fire, the error (due to precision of teeth) is minimal;
- however, I can imagine that for an odd-fire the variations are large, and can explain every other cyl showing "better" (if the individual-power can be used at all, probably yes, but I admit I never tested with odd-fire pattern)
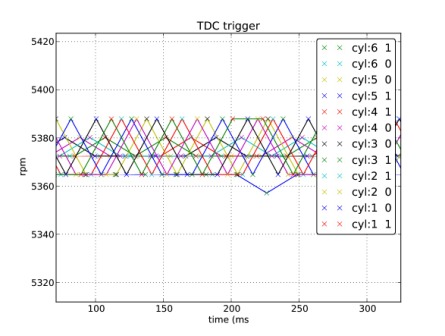
The python program now allows to plot the revolution speed of each trigger/cylinder which is under spark (bold) or not
Hereafter a zoom of the rpm from a triggerlog recorded at bench (triggers are from the VT trigger tool)
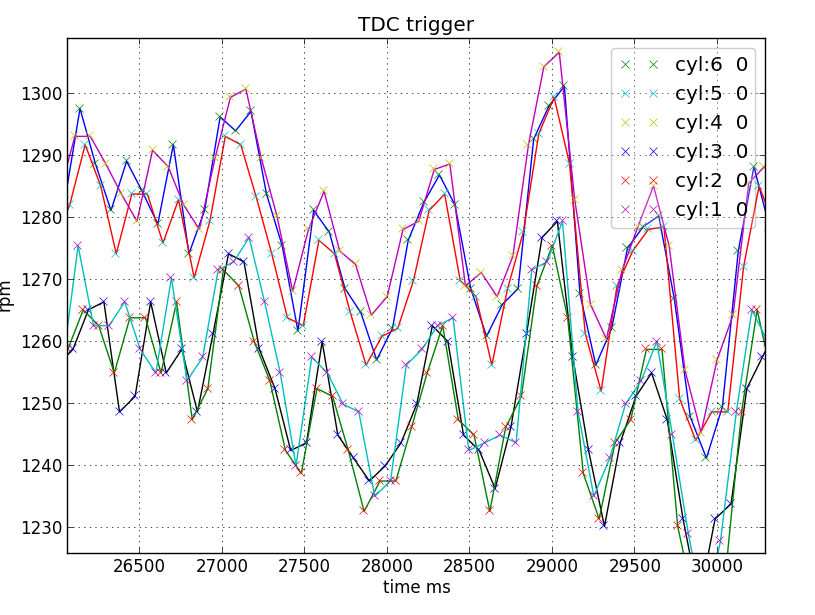
Of course triggerlogs from the running car provide more information. The rpm speed of each cylinder when it is to fire or when it is not, in each of these case, are much less noisy. We see here after per example that the speeds of the cylinders of the left bank(6,5,4)are faster than the speeds for the right bank cylinders(3,2,1). This could be explained by the first group being closer from an ignition than the cylinders of the second group.
I have not yet observed the noise shown hereabove by the vemslog plots.This could prove that the noise is done by the genboard fw.Further logs are necessary
A full analyse of the trigger log whould also give information on the state of the engine and on the improvement obtained by tuning.
April 2013
Acyclism
I have analyzed some triggerlogs from the bench to realize that the time stamps of the log files cannot be used for a close time analysis. Indeed there are, here and there some small erratic time shifts and moreover the sample frequency which is too low gives a noise level too high for a fair interpretation.
I also understood that what I am looking for is to correlate acyclism with torque to get a estimate of the best spark advance point.
Hence I have started a program to record in line this acyclism from the audio input of PC fed by the cam and crank trigs.
A good way is to apply consistently load, eg. accelerate on the same road (possibly slight uphill). Than you get good analysable results about the actual power (behavior), eg. the RPM-climb/sec that involves 300 events. Data from each event has more error and of less use in general, but the "individual power" data, (hotkey ALT-5) is there for comparing cylinders.
RPM oscillations
I am still getting here and there oscillation of the speed, as I have noticed above, which amplitude can be as large as 200 rpm.
There are other logs here after
or
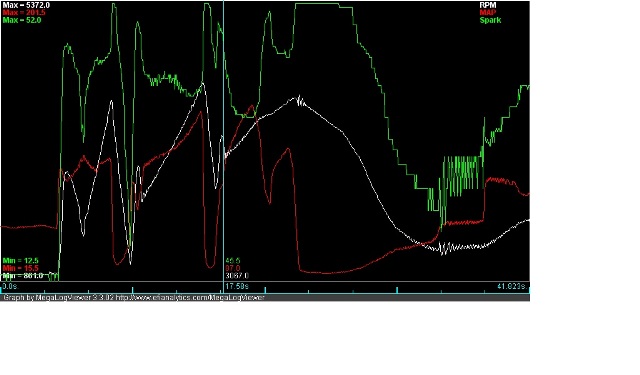
(green=Spark, white=RPM,red=MAP, yellow=TP
Actually, it seems that these oscillations are occurring when throttle opens or closes
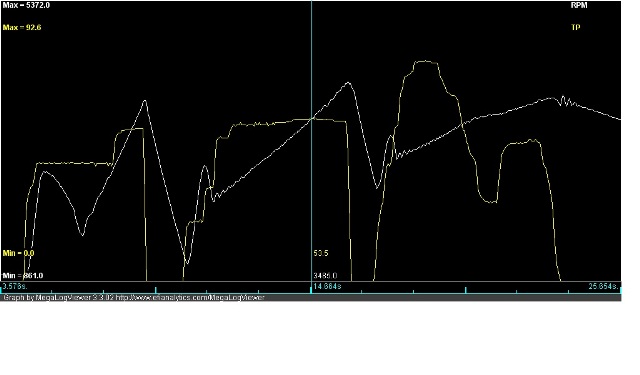
Time period of the oscillations could be = 0.18s
Has someone already seen such things?
Is it software or engine related or both?
September 2013
I have set aside the project I had to measure the acceleration/couple following each firing since the triggerlog data was not precise enough. I have to made a straight wav record of the trigger pulses.
Instead I started to tune the injection and so I did some programs in order to calculate the lambda mean and standard deviation. This result is already given by some VT tools, but I have noticed that the results are not always consistent depending on the quality of the runs and besides, that one cannot parametrize the calculus.
At the same time, I needed to know how to fill the VE Correction table(TPS,MAT), but this is my first car and my know how in the field is short.
Here is what I got
a) Steady run definition
The red parts of the plots shows where the lambda mean would be calculated
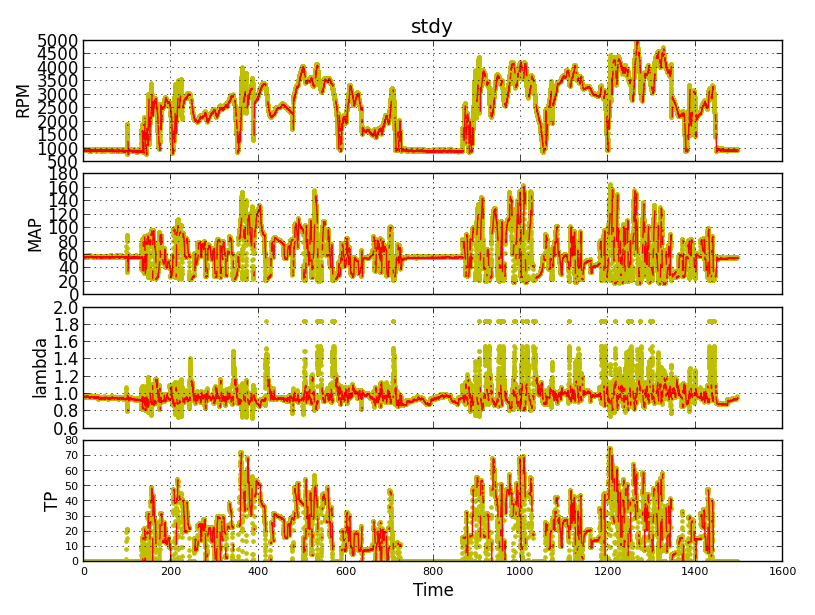
and with a zoom
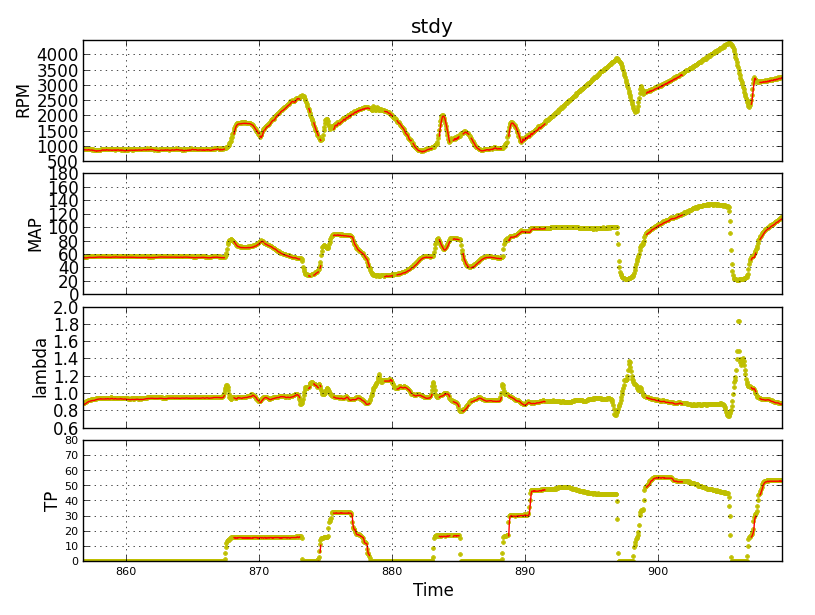
This is a first shot. Many parameters can be further tuned in the program to get rid of unwanted parts or unrelevant points (RPM variation, TP speed,etc) which have nothing to do with clean steady running
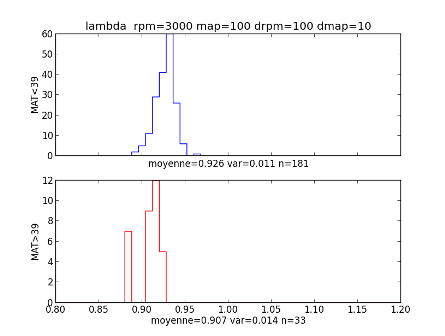
b) Lambda versus MAT
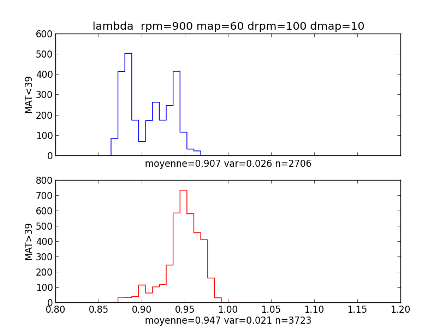
These 2 histograms are done from the above steady parts of the vemlog, one compute CLT<39 the other one for CLT>39
The events are those for which 800<RP<1000, 50<MAP<70
This shows by how much the engine runs leaner at idle TP=0 when MAT is hot.
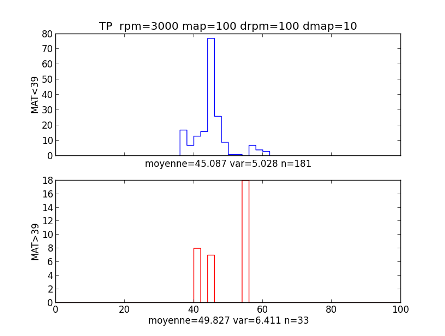
What about 3000rpm?
Of course one want to know in both cases what was the TP value.
If someone is interested in Python programming, please tell.